

Technical Writing Tips: Add Visual Effects to your Document
This article contains tips and tricks on how to write better technical documents.


* Disclaimer: All examples, either paragraphs or charts are not facts. These are examples I made up to help show my point.
Introduction: The idea behind this article
I recently started reading Technical Writing for Dummies. It’s a delightful book even though it’s a bit old (released in 2001). I’ve been learning a lot through this book and taking notes. Recently, I finished reading chapter 5 which explains how to better design your article and things to do for better visualization. I took A LOT of notes in this chapter that are helpful so I thought I would share!
Note that the book gives tips on both electronic documents and printed documents. I was only interested in the electronic documents tips because that’s what I do. I recommend getting the book because it has a lot of tips, way more than the ones mentioned in this article (I’m quite literally sharing notes on one chapter).
So, let’s get started!

Why Visuals?
Everything in this chapter of the book is about how to make the technical document look better through visuals. But why bother?
There are two main reasons to apply good visual practices in your article:
- It gives better structure to your article.
- It grabs the attention of your readers.
Sentence and Paragraph Length
Reading big chunky paragraphs is not the most exciting thing to do as a reader. That’s why it’s crucial to know when to add breaks. Paragraphs and sentences should be manageable bite-sized chunks of information.
Break down Compound Sentences
Compound sentences are those sentences that are separated by and or but. The idea is to remove those linking words and break the sentence into two sentences. Sentences should not exceed 25 words give or take.
Example:
Lengthy Sentence (39 words): There is a clear distinction between React and Angular but most people find that React is easier to learn and they say that React gave them a sense of comfort and joy while learning it.
Good Alternative: Although there is a clear distinction between React and Angular, most people find that React is easier to learn. They say that React gave them a sense of comfort and joy while learning it.
Limit Paragraphs to eight lines.
Dense paragraphs make the readers intimidated and they find it harder to subdivide your thoughts. Each paragraph should contain only one point that you would like to make. This helps the readers to visualize your ideas better.
On the contrary, writing short, choppy paragraphs will make it difficult for the readers to find logical relationships between your ideas and thoughts.
The Power of Headers
Headers help break down an article into topics. Readers can skim through a technical document reading only the headers to find the piece of information that they want to read. That’s why it’s important to write informative headers that give the readers a sneak peak of what is written in the text under it.
Examples:
Informative: Introduction: XYZ is the future framework
Noninformative: Introduction
Informative: 63% of developers prefer X over Y
Noninformative: Report of developers’ survey
Lists, Lists, Lists!
We use lists to visualize content better. Sometimes we use numbered lists to give weights to the items on the list (the item that comes first is the most important item). Other times we use bulleted lists to give all items the same weight.
Using numbered lists
There are three main reasons to use numbered lists:
- Show items in order of priority
- Describe steps of a procedure
- Quantify long lists so the readers don’t have to count the list themselves.
Using bulleted lists
We use bulleted lists when the sequence or rank is not important. Bulleted lists should not be too long and should have a descriptive sentence of the list before them.
General Guidelines when writing lists
There are certain guidelines that are applied to lists whether they are bulleted or numbered. These guidelines include parallel structure, punctuating properly and breaking lists into manageable chunks.
Parallel Structure
The rule is simple: all elements that function alike must be treated alike. For example, if you decide that the first sentence in a list is a gerund (ends in -ing) then all the following elements should be gerunds as well.
Example
Parallel Structure:
The software developer life cycle includes:
- Planning the project
- Defining the requirements of the project
- Designing and prototyping
- Developing the program
- Testing the program
- Deploying the application.
Nonparallel Structure:
The software developer life cycle includes:
- Planning the project
- Define the requirements of the project
- Design and prototyping
- Developing the program
- Testing the program
- Deploying the application.
Notice how the points that are not gerunds stand out over the rest of the list. We don’t want that!
Punctuating a list
One of the most confusing things that I always struggled with is when to use a colon to introduce a list and whether I should put a period at the end of every item in the list. Luckily, there are rules that exist to help in punctuating a list.
Colons:
Use a colon to introduce the list when the words the following or as follows is implied. Never use a colon after a verb.
- Consider the following:
- Consider these ideas: (The following is implied)
- The procedure is (no colon here because is is a verb)
Periods:
Use periods after each item when the items are complete sentences. If the items complete the sentences (like the example in parallel structure) put a period at the end of the last item only. Don’t use periods when you’re listing things that don’t form a sentence (like a grocery list).
Laundry Lists
When there are too many items on the list, there is a huge chance that users will just gloss over that list and not actually read it. In that case, you should break the items of the list into categories.
Example:
Laundry list:
The following is a list of the most famous frameworks used by developers:
- React
- Angular
- ExpressJS
- Flutter
- React Native
- VueJS
- Django
- Ruby on Rails
- Xamarin
List with logical categories:
The following is a list of the most famous frameworks used by developers:
- Frontend
- React
- Angular
- VueJS
- Backend
- ExpressJS
- Django
- Ruby on Rails
- Mobile
- Flutter
- React Native
- Xamarin
A Picture is Worth a Thousand Words
Humans love pictures, we are great at interpreting them and they are the first thing in a document that grabs our attention. There are several types of “pictures” you can add to your technical documents including charts, graphs and tables.
Charts and Graphs
Some tips to keep in mind when creating charts and graphs:
- Charts and graphs should have a descriptive title
- Charts and graphs should be scaled properly. Don’t make the scale of a graph from 0 to 20 when you know that the range of the data is from 0 to 10.
- Charts should have a legend if it is not self-explanatory
- Charts and graphs should have a straightforward design. Don’t put details that don’t add to the graph to not confuse the readers.
- Charts and graphs shouldn’t have too much information. If you try to squeeze too much information in one graph, you defeat the purpose of making it simple to read. Instead, make a chart or graph for each point.
- Charts and graphs should be as close to the text that refers to it as possible.
Pie Charts
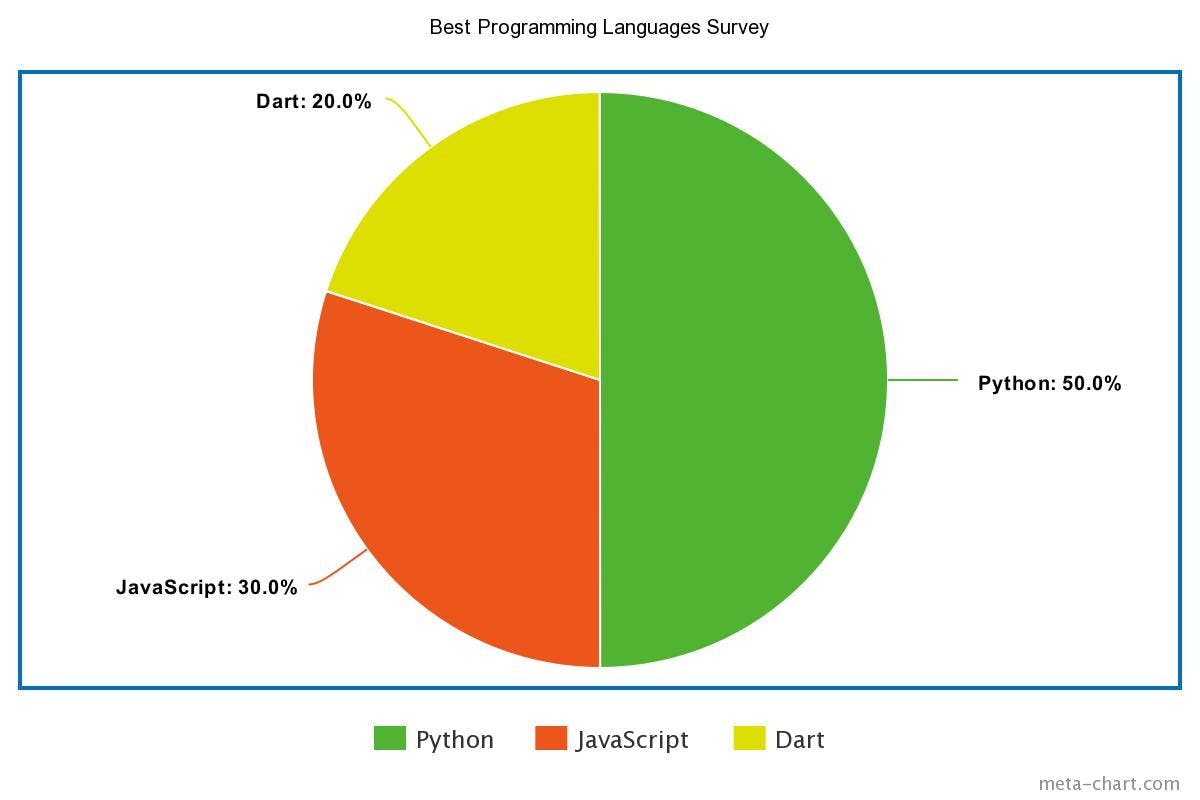
Pie charts are great for visualizing percentages. There are two main ways to design a pie chart:
- Begin the most important percentage at 12 o’clock and continue clockwise
- Begin the most important percentage at 12 o’clock and continue counterclockwise
You are free to choose any!
Line Chart
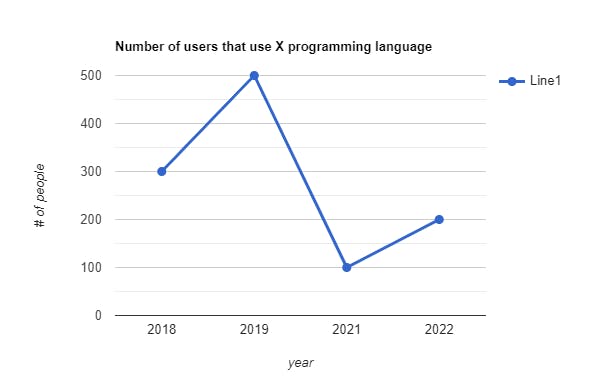
Line charts show the trends or the change of one or more variables over time periods.
Run Chart
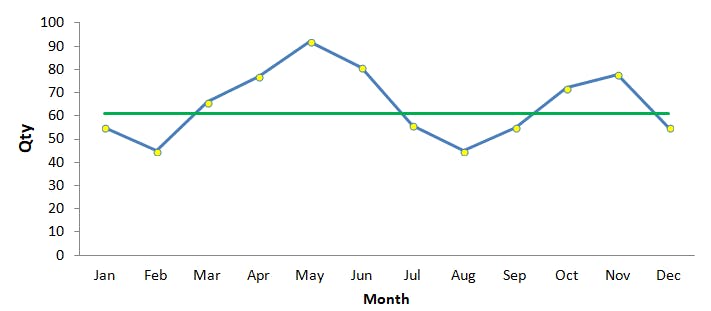
Run charts are like line charts but they show the incidents above and below an established data point. This way you can measure how good or bad the data is.
Histograms
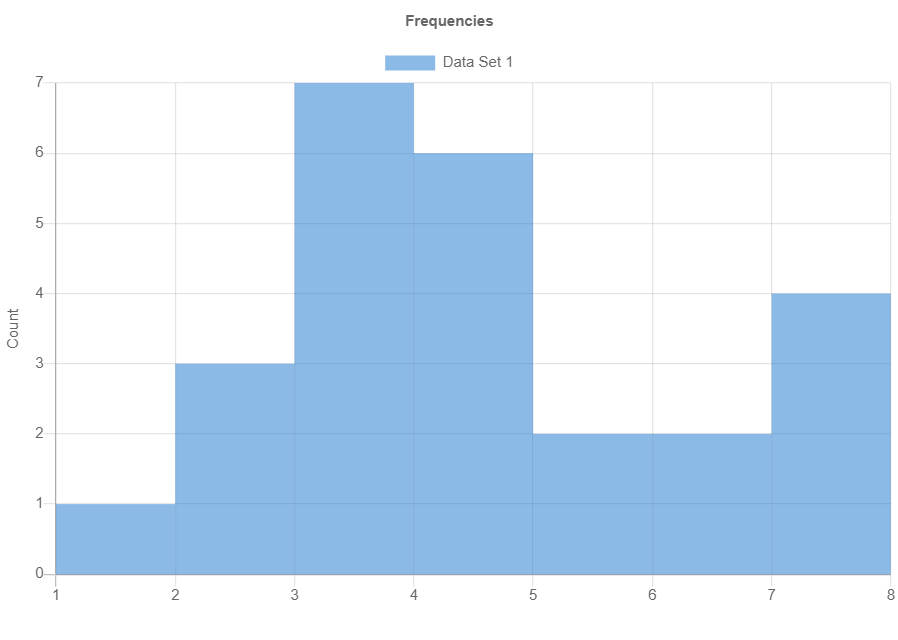
A histogram shows the relative frequency of occurrence, central tendency and variability of a dataset.
Pareto Chart
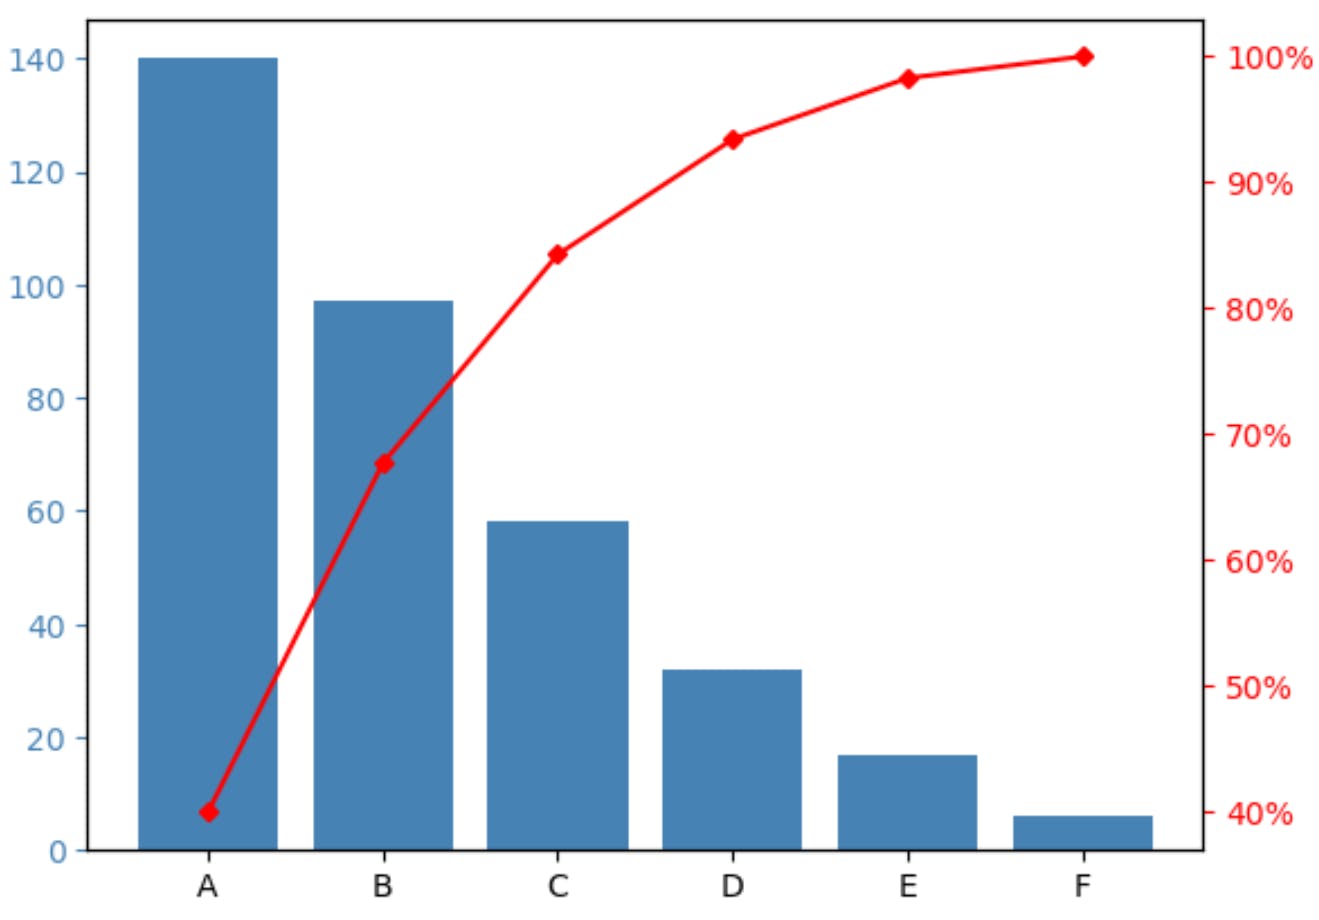
Pareto Charts are used to separate vital information from trivial information.
Gantt Chart
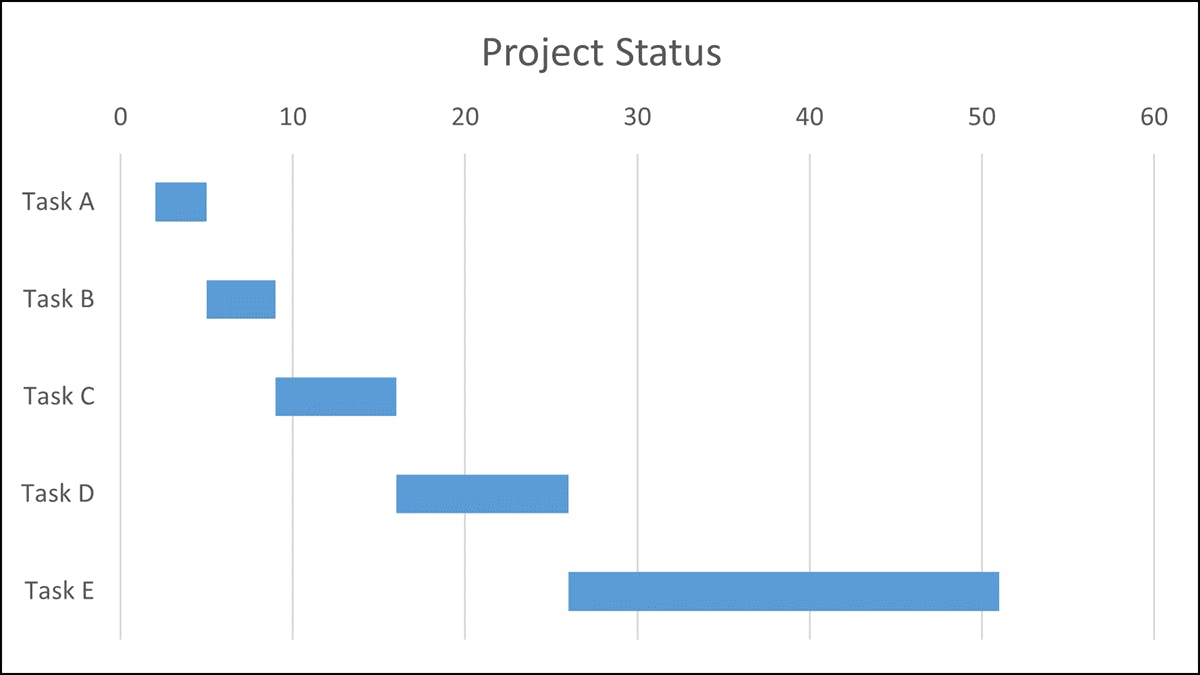
Gantt charts are used to show timing relationships between the tasks and subtasks of a project.
Scatter Chart

Scatter Charts are used to display the relationship between two variables. It’s useful for pinpointing the cause of a problem and shows how one variable may relate to another variable.
Flow Charts
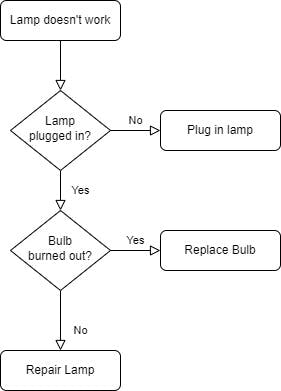
Flow Charts are useful to display the major steps in a process using flowchart symbols.
Tables
Tables are used to show related information in a compressed way. They carry more information per space than the same amount of text.
Formal Tables
Table 1: Complexity of Languages
| Language | Easy | Medium | Hard |
| Python | X | ||
| C++ | X | ||
| C | X | ||
| Java | X | ||
| Dart | X | ||
| Swift | X |
Formal Tables are tables that contain essential information and often contain numbers. It is important to style these tables right for ease of reading. For example, it’s good practice to shade every other line so that the reader can follow the row easily.
Informal Tables
| Action | Risk |
| Sitting for too long | Backpain and trouble sleeping |
| Drinking too much coffee | Brain go brrr also Anxiety |
| Making Yosra write for too long | Sentences like the cell above this one are created |
Informal Tables are extensions of the texts and don’t have headings or table numbers. They are used to format text better.
Conclusion
I’ve been in love with technical writing for a year now. Part of my love for technical writing comes from my love for reading other people’s writings. The book I’m reading currently is super helpful for technical writers and I recommend everyone to read it.
This is my first time sharing my notes on a book I’m reading so let me know if you want to read more stuff like this! There are more chapters in this book that I’m so excited to learn from :)
If you want to reach out to me, you can find all my socials in this link. Feel free to drop a message and talk about anything! Ciao 👋🏻